How the IoT is keeping traffic moving and the streetlights shining
Keeping the road infrastructure moving is a 24hr job but the IoT can help, according to Yotta.
The next time your car bottoms out on a nasty pothole, grit your teeth and try to spare a thought for the people trying to end that problem and smooth out your journey.
Yotta helps local authorities and utility companies understand their infrastructure – like roads and streetlights – better by surveying and analysing the environment. ZDNet talked to Manish Jethwa, Yotta’s chief product and technology officer, to find out more.
ZDNet: How would you describe Yotta and the business you are in?
Jethwa: We’re a technology business that has been around for some 25 years in the highways arena. We gather information mainly from manual surveys and we build our own vehicles that go around surveying highways, essentially taking laser measurements of every millimeter across the carriageway of the roads and building up very detailed models of the condition of the road network.
And from there we have progressed to the analysis of that data to try and provide insight for our customers – they can then drill down into that data and extract the key areas where treatment is required; in other words, making strategic decisions about where they are spending their money on the highways infrastructure.
Over time we have launched out into different asset classes through acquisition and organic growth into things like streetlights.
This has all come together with this Alloy application that we have been working on for a couple of years now.
So this is a matter of mapping the roads and monitoring their condition — but to what level of detail can you go?
The survey vehicles themselves will connect the information down to the millimeter. And in terms of the height and the texture of the roads, you can get it down to nanometers on the road’s surface. It’s a very detailed measurement.
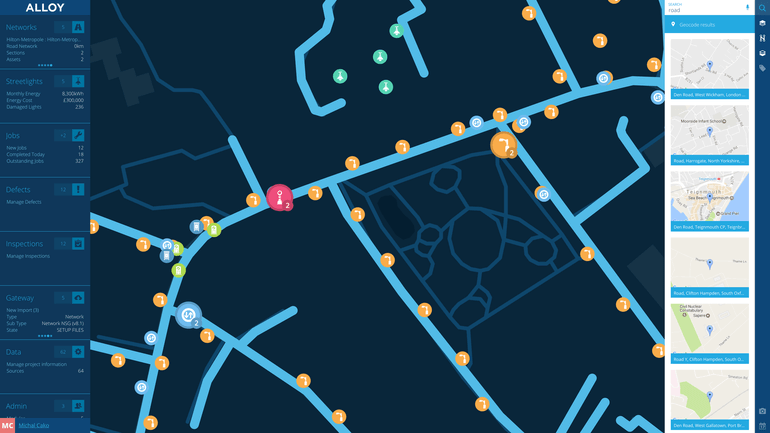
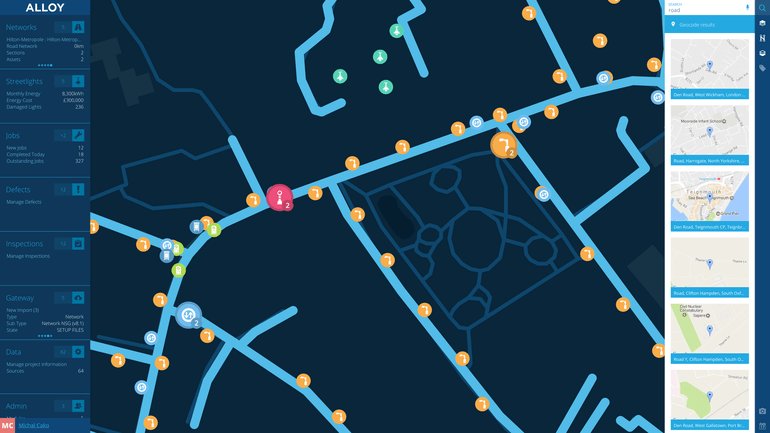 Alloy gives local authorities the power to see all the infrastructure from street lamps to defects and highlights jobs that need to be done or are being done. Source: Yotta
Obviously trying to deliver that quantity of data out to the user is not really feasible, so typically you aggregate it up. And then you statistically aggregate it up with 10-metre reporting lengths on a particular lane. You’re basically saying, “What is the condition of this 10-metre lane-length?”
How does this all work? Presumably you will work with all the different councils around the country who are customers of yours?
Yes, the local authorities and even the national agencies like Highways England that manage the complex networks of all of the major roads, are our customers.
Previously we’d have been doing the surveys and actually collecting the data but now we are much more focused on the software and services element, and being able to make the most use of that data.
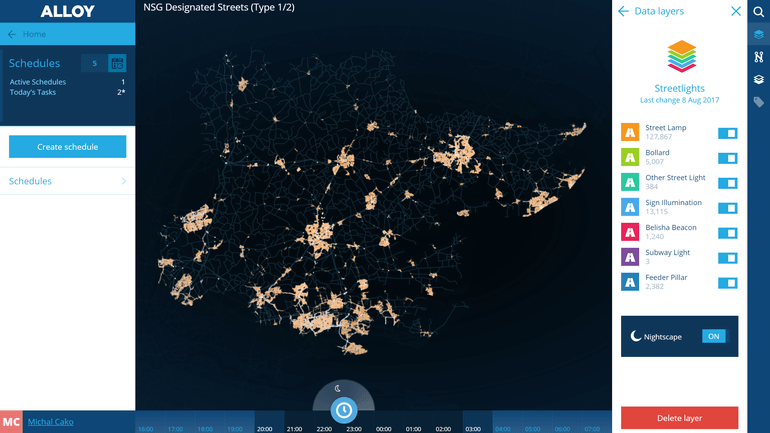 The city at night and Alloy shows the street lights and from here the user can burrow down to see each individual light. Photo: Yotta
We are somewhat agnostic as to where the data comes from — whether it comes from censors or comes from surveys that have been conducted out in the field — and we aim to provide the software that can take all of that data and make the right decisions for them. Or assist them in making the right decisions operationally and strategically.
Is surveying the roads the only way to collect the information?
The survey vehicles are expensive — they can cost anywhere up to half a million pounds — because of the range and number of technologies that are on there.
The expense typically means that there aren’t that many vehicles around. And in turn that means that the frequency of surveys is low — up to a year or every couple of years.
And, of course, the IoT will be embedded in new assets as they go out. But it’s important that we also embed the sensors into assets that are coming near to the end of their life because it’s really those bits of infrastructure that are going through the latter part of their lifecycle that are going to be falling below the service levels that we are interested in.
If we only embed the sensors into the new infrastructure, it’s going to be another 20, 30, 40 years before those infrastructure assets fall below the service level and so it’s kind of critical that we embed the sensors into the infrastructure that has already been bedded in for decades.
Tell me about Horizons
Horizons is a pavement asset-management tool. When I say pavement, I mean any part of the surface which is paved — roads, pavements, cycle tracks.
So, there’s quite a lot of work that’s happened on the road infrastructure and this idea that you collect data periodically for all of your assets and then you can start to make decisions into the future. By creating statistical analysis on that data, you can predict what’s going to happen to those assets in the future.
And taking that idea and embedding it across all of those assets is what Alloy will do.
Right now, Alloy is used much more as an operational tool — to help you manage the jobs out there, taking the data from a number of embossed sensors or from surveys, etc.
Basically, it highlights the assets that require work and makes the work flow efficiently.
An example of this might be looking at the street lights and sensing the type of lamps that typically have defects over a specific period. You can then estimate how many of those types of lamps are likely to fail in future years. And you can budget for them instead of saying, “I’m going to wait for these guys to fail and then go out and fix them”.
So ideally, before the pieces of infrastructure fail, you want to have the assets in place to fix them?
Yes, you just want to harness all the data. Street lights are a great example because if you want to embed sensors in, they have a fixed source of power there, so you don’t have to worry about that and they can also serve as a kind of way-point for other types of devices and sensors which is embedded in.
The drain network, for example. When the gullies get blocked and overflow, that can have a huge impact on all the other infrastructure that’s around.
Typically, the types of fault that we see with the road surface are cause by water ingress in between layers — with cold water that then freezes and therefore expands causing potholes to appear.
The science behind it is fairly well known, but the fact that you’ve got different assets that are interlinked will have a cause and effect across different assets.
Historically, this has been dealt with by trying to create a single map layer showing all the assets. But in connected-asset management this whole thing can go a stage further to ask, “What are the dependencies between these two different asset types?” Then we can start to monitor which different gullies are being blocked, where are the different flood areas, what possible impact can that have on some of the different assets groups that are around and so on.
Presumably you expect that over time this will have an impact on cost?
Absolutely. Over time it’s all about enabling us to make more efficient use of all of the assets that we have.
All of the assets are being put under greater and greater strain from weather, increasing population, increasing traffic and so on. It’s all about trying to make better use of the assets and then, at the same time, reducing the cost.
When something does go wrong you can find out immediately and get out there and resolve it.
What do you see as the next big thing in this area?
Essentially it’s about how do you take these various asset classes and really try to calculate the dependencies between them and that has to come from a pattern recognition, machine-learning-type of approach.
You’ve got all this data coming in and all of these dependencies are well understood, but there are other dependencies that are much more complex and down to weather, etc. How do we make much more use of that data?
We can know there is a connection, but it is much more complicated trying to calculate that from an algorithmic standpoint.
The only way you can really do that is by pushing the data into a machine-learning approach and then trying to identify the different links.
